
Scaling a business isn’t just about increasing revenue; it’s about doing so sustainably and efficiently. As founders and go-to-market leaders transition from Product-Market Fit to Go-to-Market Fit, they often encounter a critical challenge: understanding and applying unit economics to their strategy.
At Stage 2 Capital, we've seen this transition trip up even the most promising startups. It's not just about proving value anymore, it's about replicating that value at scale. This week on the Stage 2 Blog, our Limited Partner, Brent Holloway, shares his Sales Productivity Calculator and framework—an easy-to-use tool for mastering unit economics. Brent breaks down why these metrics matter, which ones you need to track, and how his calculator can guide your business through this critical growth phase.
Understanding Unit Economics: The Bridge Between Product-Market Fit and Go-to-Market Fit
Guest Post by Brent Holloway, Stage 2 Limited Partner
From Proving Value to Scaling It
Product-Market Fit happens when your leading indicators of retention show you're consistently delivering customer success. But Go-to-Market Fit is the bigger challenge: Can you scale that success and make it repeatable?
This is where unit economics comes into play. They provide the blueprint for how to allocate resources, design sales models, and project growth sustainably. In essence, they help founders move from intuition-driven decisions to data-backed strategies, creating the foundation for long-term scalability.
Why Unit Economics Are Critical
Your unit economics make or break your go-to-market strategy. They tell you if your sales model can actually fuel growth - and where you need to fine-tune things. Skip this step, and you'll likely make the same mistakes many startups do: hiring too many salespeople before really nailing down your process, chasing revenue while customers slip away through the back door, or getting blindsided by how much it actually costs to land new customers.
By analyzing unit economics, you gain insights that help you:
- Determine if your sales model is financially viable.
- Set realistic quotas for new hires, factoring in ramp time and expectations.
- Forecast growth with greater confidence, reducing the risk of missteps.
- Allocate resources more effectively to maximize returns.
This level of insight isn’t optional—it’s necessary to scale without unnecessary risk.
P.S. In this recent Inside Catalyst blog series, Stage 2 broke down the essential components for Go-to-Market Fit, and how to calculate each: unit economics, efficiency metrics, and cohort analysis.
Key Sales Metrics For Sustainable Growth
To unlock the full potential of your GTM strategy, you need to track a set of interconnected metrics that provide a clear picture of your business’s scalability. These include:
- Opportunities Created: The number of deals entering your pipeline.
- Sales Cycle Length: The time it takes to move deals from prospecting to close.
- Win Rates: The percentage of deals your team successfully wins.
- Average Sales Price (ASP): The value of a typical deal.
- Customer Acquisition Cost (CAC): The fully loaded cost of acquiring a customer, including marketing, sales salaries, and tools.
These metrics are not just numbers to track, they are levers to pull, analyze, and optimize to drive scalable growth. For example, increasing your win rate or reducing your sales cycle length can dramatically improve sales productivity and accelerate revenue growth.
Introducing the Sales Productivity Calculator
To make these metrics actionable, I'm sharing a new resource: the Sales Productivity Calculator. A tool designed to help founders optimize their sales strategy and simplify complex data into actionable insights.
With the Sales Productivity Calculator, you can:
- Model the number of deals each sales rep needs to close to hit quota.
- Explore how changes in win rate or average deal size impact sales productivity.
- Understand the relationship between sales cycle length and quota attainment.

The calculator takes the guesswork out of sales planning, enabling you to adjust variables and quickly identify the feasibility of your sales targets. Whether you’re planning your next sales hire or refining your go-to-market approach, this tool is a game-changer.
Understanding Unit Economics With Real-World Examples
Let's look at two common scenarios that early-stage startups face when scaling their sales teams.
Scenario 1: Optimizing an SMB Sales Motion
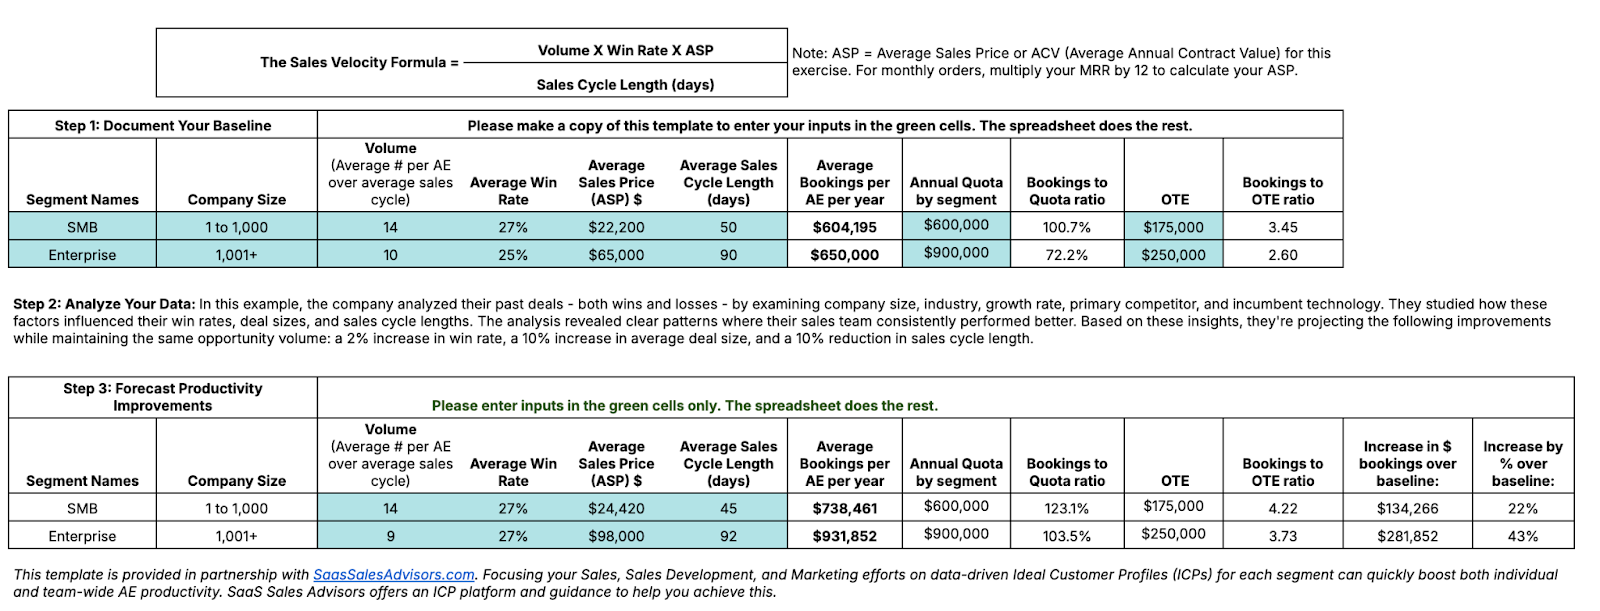
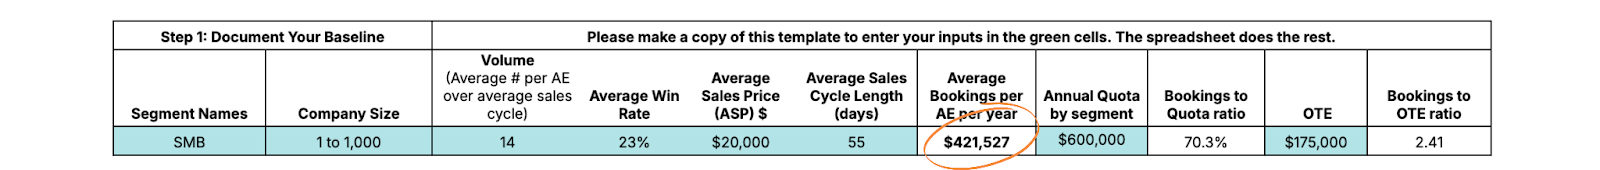
Many startups begin with an SMB-focused sales team, targeting smaller deals with shorter sales cycles. Consider a typical scenario where a startup's Account Executives have a $600,000 annual quota, but they're consistently falling short despite handling a healthy volume of opportunities.
Baseline Metrics:
- 14 opportunities in pipeline per AE
- 23% win rate
- $20,000 average contract value (ACV)
- 55-day sales cycle
Plugging these data points into the sales productivity calculator, we see their average annualized sales productivity across the team was $421,527 per AE per year (a 30% shortfall).
But digging into the sales productivity data, the CRO and RevOps leader could model how small improvements across different funnel metrics would compound to impact overall quota attainment. Instead of defaulting to hiring more reps – a common but expensive solution – they could see how targeted improvements in win rates, deal size, and sales cycle length could dramatically improve productivity across the existing team.
They analyzed their wins and losses across firmographic, technographic, and intent data to identify where deals moved most efficiently through the pipeline. After communicating and adapting their pipeline generation efforts and pipeline reviews toward the account types with the ICP criteria the team was able to:
- Increase win rate by 4% (from 23% to 27%)
- Grow average deal size by $2,000 (from $20,000 to $22,000)
- Shorten average sales cycle by 5 days (from 55 to 50 days)
The volume of opportunities per AE stayed flat at 14, as the focus was on working smarter, not harder. These seemingly modest improvements compounded to increase average bookings per SMB AE to $604,800 – a 43% boost in productivity without adding headcount.

Scenario 2: Evolving to Enterprise Sales
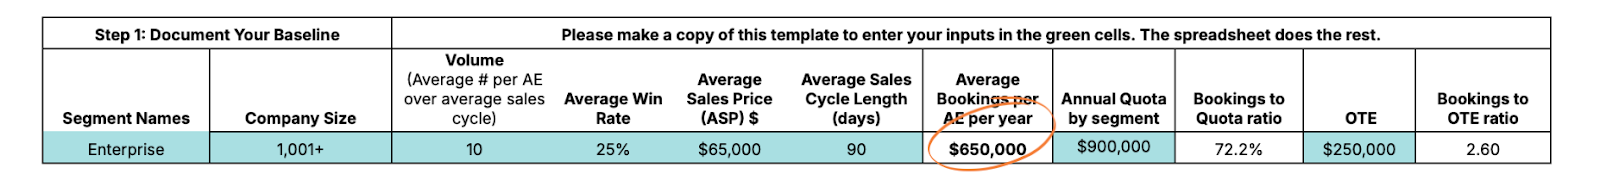
Let’s look at a scenario where a startup's Enterprise Account Executives have a $900,000 annual quota, but their inconsistent deal sizes and longer sales cycles were causing them to miss targets.
Baseline Metrics:
- 10 opportunities in pipeline per AE
- 25% win rate
- $65,000 average contract value (ACV)
- 90-day sales cycle
Plugging these data points into the sales productivity calculator, we see their average annualized sales productivity across the team was $650,000 per AE per year (a 28% shortfall).
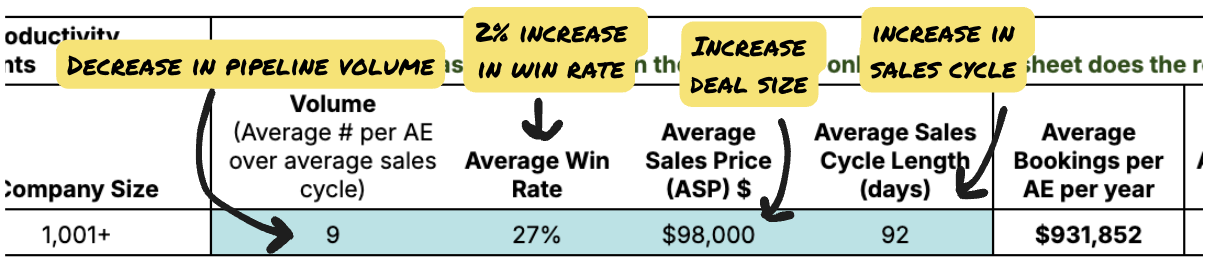
Using the sales productivity calculator, they discovered that their best path to increased productivity wasn't through higher volume, but through better deal selection. The data showed their most successful enterprise deals were actually larger opportunities with stronger product-market fit, even though they took slightly longer to close.
After analyzing win/loss patterns across firmographic, technographic, and intent data, they made the bold decision to focus exclusively on these higher-value opportunities. This strategic shift resulted in:
- Decrease in pipeline volume by 1 deal (from 10 to 9 opportunities)
- Increase in win rate by 2% (from 25% to 27%)
- Increase in average deal size by $33,000 (from $65,000 to $98,000)
- Slight increase in sales cycle by 2 days (from 90 to 92 days)
By deliberately working fewer but larger deals with better fit, these modest adjustments compounded to increase average bookings per Enterprise AE to $931,852 – exceeding quota while actually reducing the number of deals in the pipeline.
Avoiding Common Pitfalls
The journey from Product-Market Fit to Go-to-Market Fit is challenging, but with the right tools and focus on unit economics, it's a challenge you can overcome. I encourage you to take advantage of the Sales Productivity Calculator here.
We'd like to extend a thanks to Brent Holloway, one of our LPs, for sharing this practical tool with our community. Brent is the founder of SaaS Sales Advisors which provides a sales productivity and ICP platform to help companies quickly quantify their most productive and efficient sales scenarios by region and by segment.